
Вигинский В.А., Громин В.И., Чаицкий В.П., Паталаха Е.И. Микроструктурные признаки тектонофаций эпизоны // Разведка и охрана недр.- 1998.- № 1.-С. 2-8.
г
Viginsky V.A., Gromin V.I., Chaitsky V.P., Patalakha Ye.I., 1998V.A.Viginsky, V.I.Gromin, V.P.Chaitsky, Ye.I.Patalakha
(Kubangeolkom, AO"Krasnodarneftegeofizika",
NIPITermneft, Ukrainian National Academy of Science).
MICROSTRUCTURAL INDICATIONS OF THE TECTONIC FACIES IN THE EPIZONE
The structural and paragenetic approach development resulted in the emergense [1] and the consequent rapid progress of the tectonic facies doctrine [2-5]. The docrine is based upon several theoretical propositions, providing opportunities to create a single rocks classification according to the degree of deformation. The idea of the vertical structural zonation of the Crust is one of these propositions, as well as the proposition of the dislocation mechanism’s suture pattern, which took the form of the tectonic flow docrine [6].
The tectonic facies is traditionally treated as rock sequences which differ by the deformation degree, defined throuth the structural elements’ aggregate (that is the characteristic paragenesis). With all that the main structural indications’ variations are determined by the elements’ correlations of the main structural triad (RЅ Ѕ S2Ѕ Ѕ ab) implicating the syngenesis of the faults (R), penetrating cleavage (S2) and the folds’ axial planes (ab). Cleavage is the main structural mark under the mesozone conditions while the cristallization schistosity is under the katazone conditions [2]. Until recently it was supposed that within the epizone (that is the nonmetamorphized sedimentation cover found to the cleavage front) the above-mentioned structural triad was transformed into a paragenesis eliminating the penetrating cleavage and represented by faults and folds so that RЅ Ѕ ab [5]. Such an approach offers the schistosity rather than cleavage as the structural mark.
With all that, the axial orientation of the rock microstructure linear elements may be represented as a certain cleavage analogue within the epizone, as some studies of the coherent and consolidated (non-metamorphised) rock micro- and macrostructure revealed under conditions of stress deformations [7,8]. In this connection the microstructural analysis makes it possible to approach the tectonofacies indentification based on the rock inner structure linear elements elucidation and their orientation relative to lamination. This paper tries to fulfil such an approach.
Methodology
The problem under consideration is discussed for some anticlines of the West Kuban foredeep (Krasnodar territory), representing siutable objects for such studies. The Anastasievsko-Troitskaya, Lyovkinskaya and Novodmitrievskaya anticlines (fig.1) are distinguished by rather simple structure (along the surface of the compexes under consideration) forming a sequence of the “tectonic flow” manifestation, which is defined as a fold “tension” parameter (N=A/L*1000?, where A is a given point amplitude, L is a fold width of a given section within the first encircling isohypse).
Fig.1. Position of the anticline folds under consideration.
The data statistical presentation is an important object selection criterion as well (at least 10 drill holes characterized by the studied layers’ microsections within the fold under consideration, making it possible to fix more than 40 linear elements’ measurements). The Cenozoic deposits were studied within the above-mentioned areas, that is the Paleocene to Eocene complex at the Novodmitrievskaya, the Eocene deposits at the Lyovkinskaya, the Upper Miocene (mainly the IV Meotian productive layer) at the Anastasievsko-Troitskaya. The latter eliminates feasible methodological restrictions connected with one or another stratigraphic correlation of the complexes under consideration.
V.L.Yegoyan presented nessessary sandstone and siltstone microsections which were used to measure the rock elongated components inclinations and the grain cracks inclinations relative to the microlayers, or the rock flat parallel structure partition elements of the microsection (thickness
< 1 mm). The microlayers consist of the clay, silt and sand material, pelitomorphic siderite, the microfauna accumulations and the carbonized plant remnants. There are the microlayers with the basal clayey cement within the rock of the same porous cement, the microlayers with the clayey cement within the cement-free grain accretions, the micrilayers with the clayey cement enriched with the pelitomorphic siderite, the microlayers with the interrupted grain pattern too.The rock elongated elements are represented mainly by the quartz and feldspar grains, sometimes by faunistical and carbonized plant remnants and occasional mica scales with the long axis 3 times and more longer than the short one.
Microcracks are found sometimes within some qwartz and feldspar grains and the mica scales. Some of them show the grain parts’ dislocation relative to each other. There are through, grain-crossing and attenuating microcracks, for the most part they are not mineralized, being infilled with the calcite poikilitic cement only. There are microcracks within both isometric and elongated grains, the latter show the microcracks at the greater inclination (close to the right angle) relative to the long axis. The studied sandstones and siltstones show occasional calcite veins oriented by 62
° to 90° (more frequently 67° to 85° ) relative to the microlayers. It is noteworthy that the modal values of the grain microcracks pattern lie within the 76° to 90° interval, that is the macrocracks inclination practically coincides with the microcracks inclination relative to the rock lamination. The bitumen veins lie more frequently along the microlamination or by the 4° to 7° inclination relative to it, ocasionally up to 40° . It is found that there is a direct relationship of the grain cracks value and the debris dimensions and the inverse relation of the value and the clayey cement content.Both measurements of the sedimentation rock elongated elements’ inclinations relative to the microlamination and grain microcracks inclinations measurements relative to the same microlamination were made in the microsections. Cleavage jointing and cracks formed during the microsection making were not taken into account. One should bear in mind that rutile needles incorporated into the quartz grains are very much alike to the cracks. They were not taken into account, when possible, too.
The rock elongated components inclinations measurements relative to the microlamination and the grain cracks measurements were made as follows. The MIN-8 polarizing microscope with a preparation driver was used to fix the microsections. The microlamination position was assumed to be a relative zero. The rock and microcracks elongated components orientation was measured from -90
° to +90° relative to the lamination (fig.2). 
Fig.2. Diagram of the rock elongated elements and microcracks orientation distribution relative to the lamination (Novodmitrievskaya area, drill site 50, interval 2884-2893 m).
One can see that the modal lamination deviation and the rock elongated components (grains as shown in figure) values are placed symmetrically relative to zero, as well as that of the microcracks. That is why the observation sector could be restricted by the interval of 90
° (fig.3), which made it possible to facilitate the process of the inclination measurements of the observed parameters relative to the lamination (fig.4).

I

II
Fig.3. Diagram of the rock elongated elements and microcracks orientation distribution relative to the lamination (Lyovkinskaya area, drilling site 140, interval 4195-4203 m). I - modal deviation distribution of the rock elongated components (grains) and microcracks relative to the lamination within the 180
° interval; II - modal deviation distribution of the rock elongated elements (grains) and microcracks relative to the lamination within the 90° interval.

Fig.4. Diagram of the rock elongated elements and microcracks orientation relative to the lamination (Anastasievsko-Troitskaya area, drilling site 1015, interval 1875-1880 m).
Comparing the elongated components orientations inclinations modal values inn the rock andmicrocracks relative to the lamination (fig.2-4) revealed that one of the rock (grain) elongated components’ mode coinsides with the microcracs orientations’ minimum value (marked by a triangle arrow in figures 2-4) at the sufficienntly high level of the maximum’s compatibility. Such a fenomenon is observed in all of the specimens and seems to be of genetic origin. This is testified by the data of the Olovyanninsky overthrust’s structural and geological investigations, made by V.G.Gladkov along the right bank of Onon river [9,10], where the characteristic structural paragenesis was found in its hanging (overthrusted) block. The paragenesis is represented by a fissure belt,which axis is oriented along the displacement direction, and by the rock linear deformed elements oriented along the above-mentioned axis. The elements are actually the substance flow indicators. Obviously the ratio of the rock microsections elongated components and the microcracks developed on the plane (two-dimensional image defined by the object under consideration) is identical to the three-dimensional description of the above-mentioned Olovyanninsky flow paragenesis description. So the linear heterogeneity direction relative to the microsections’ lamination seems to manifest the tracks of the substance intrastratum flow inside the rock.
Relationship between the microsections linear microstructure inclinations relative to the lamination and the sampling (drill hole) structural position relative to the tectonic flow (defined as “tension”) was established by evaluation of the corresponding structural patterns in the “tension” values (fig.5-7). The “tension” value is similar to that of the “deformation” in terms of A.V.Vikhert). The necessity to shift to the “tension” parameter was due to the need to use such a microstructure feature (unlike the dip) which would facilitate to evaluate the “tectonic flow” manifestation on the one hand and to define the strict structural position of any observation (drill hole) point relative to the fold axis.

Fig.5. “Tension” parameter variations map of the Anastasievsko-Troitskaya anticline fold (West Сuban foredeep, Krasnodar territory). 1- drilling sites under consid
eration and their numbers, 2- “tension” parameter isoline.

Fig.6. “Tension” parameter variations map of the Lyovkinskaya anticline fold (West Сuban foredeep, Krasnodar territory). 1- drilling sites under
consideration and their numbers, 2- “tension” parameter isoline.

Fig.7. “Tension” parameter variations map of the Novodmitrievskaya anticline fold (West Сuban foredeep, Krasnodar territiry). 1-drilling si
tes under consideration and their numbers, 2- “tension” parameter isocline.
Results and interpretation
Correlations between the “tension” and the inclination relative to the “flow lines” lamination (that is an axis line of the defined flow paragenesis) were made by the stochastic law revealing within the above-mentioned Anastasievsko-Troitskaya, Lyovkinskaya and Novodmitrievskaya anticlines (fig.1). The calculations show essential and rather close correlations between the above-mentioned parameters (at the significance level of 0,05 the correlation factors R are 0,81; 0,63 and 0,69 correspondingly). The crucial correlation factor values (Rcr ) are 0,46; 0,47 and 0,35 for the three anticlines, being the values above which the calculated correlation factors are valid within the existing excerption volumes (fig.8).

|
Корреляция (R) |
"Напряжённость" |
Угол наклона к слою |
|
"Напряжённость" |
1 |
|
|
Угол наклона к слою |
0.588631316 |
1 |
|
Rкр=0.24 q=0.05 |
Fig.8. Diagrams of the “tension” parameter and rock flow lines inclinations relative to the lamination (the southern West Kuban foredeep). The correlation coefficient (R), crucial correlation coefficient (Rcr) and the significance level (q) values are given in the table. I - Anastasievsko-Troitskaya area, II - Lyovkinskaya area, III - Novodmitrievskaya area.
Considering the above-mentioned anticlines sequence formation according to the tectonic flow manifestation level the corerelation of the “tension” parameter distribution and the rock flow lines inclination relative to the lamination was estimated within the common excerption bringing together the three anticlines measurements. The results fix the correlation (R=0,59 when Rcr=0,24 and the significance level is 0,05). This essential correlation was tested by the regression analysis to define the fixed correlation character and the affecting parameters. The regression analysis was made both for the above-mentioned anticlines excerptions and for the common excerption being described before (fig.9).


|
y = 0.9617x + 13.523 |
Анастасиевско-Троицкая |
|
|
R2 = 0.6514 |
||
|
y = 3.0408x + 9.9109 |
НовоДмитриевская |
|
|
R2 = 0.4799 |
||
|
y = 1.7245x + 6.0094 |
Лёвкинская |
|
|
R2 = 0.3997 |
||
|
y = 1.0531x + 16.508 |
Общая |
|
|
R2 = 0.3469 |
||
|
y = -0.026x2 + 2.0352x + 8.2606 |
Анастасиевско-Троицкая |
|
|
R2 = 0.7101 |
||
|
y = -0.2216x2 + 5.1869x + 8.3978 |
НовоДмитриевская |
|
|
R2 = 0.4976 |
||
|
y = -0.0574x2 + 3.0591x + 1.459 |
Лёвкинская |
|
|
R2 = 0.4258 |
||
|
y = -0.0435x2 + 2.6143x + 9.9378 |
Общая |
|
|
R2 = 0.4475 |
||
|
Корреляция (R) |
"Напряжённость" |
Угол наклона к слою |
|
"Напряжённость" |
1 |
|
|
Угол наклона к слою |
0.588631316 |
1 |
|
Rкр=0.24 q=0.05 |
||
Fig.9. Correlation diagrams of the rock flow lines inclinations relative to the lamination and the “tension” parameter (the southern West Kuban foredeep). I - the 2nd power correlation diagram; II - the linear correlation diagram (R2 is the approximation accuracy factor). There are formulae of the regressive correlations (the 2nd power and linear correspondingly) for each of the anticline folds and for the aggregate excerption in the table, as well as the correlation coefficient value for the aggregate excerption.
The functional correlations of different orders were selected for the observed data lines using the least squares method. The polynom correlations analysis show within the every excerption the higher order functions reflecting, as a rule, the particular fluctuations increasing influence. The general parameters’ correlations regularities are revealed for the lower order correlations only (the linear and the second power correlations), which is fixed by the corresponding order trend lines’ similarity. The linear correlation seems to be more preferable in this case because it represents the most general correlation regularities which is confirmed by the minimum values of the approximation trustworthiness parameter (fig.9).
The linear correlations’ characteristic parameters analysis shows interesting conclusions. The variable quantity factor (defining the trend line inclination) is equal to almost 1 (the difference is 0,05) in the function equation for the summary excerption correlation, while the analogous factors in the functional correlations equations for the every anticline are equal roughly to 1. The factor value seems to be defined by the anticline pressing level: the higher is the pressing level (characterized by the maximum “tensity” parameter value of the apical anticline portion), the lower is the function variable quantity factor. This is to confirm the manifestation increasing of the “tectonic flow” from one anticline to another, which are forming in such a way a single consecutive series, as it was mentioned above. The variable quantity factor which is equal roughly to 1 in the correlation formula of the summary excerption seems to fix the above-mentioned succession.
The linear correlation formula definite term seems to fix the initial (sedomentogenetic) inclination of the rock elongated components, being formed under conditions of coarse-grained sediment fluvial origin. Apparently, such beds form the sedimentation complexes, represented by the thin sections under consideration (according to the rock lithologic composition: aleurolite and sandstone).
Based upon the above-mentioned statements the linear correlation formula of the “tension” parameter and the inclination relative to the flow lines’ lamination under ideal conditions (when the rock elongated components initial inclination is zero, that is sedimentation under tranquil water conditions) is embodied as
y = x.
The latter makes it possible to establish a distinct correlation of the inclination relative to the observed flow lines’ lamination and the deformation “flow” thickness to amplitude ratio (A/L), or the shear flow in terms of E.I.Patalakha [11], being a characteristic feature of the tectonic facies. So the studied parameter (inclination relative to the flow lines’ rock lamination) may serve as an analogue of the inclination relative to the cleavage lamination typical for the mesozone, which makes it possible to formulate the main structural epizone triad:
R
| | ab ^ Q ,where
Q is the deformation rock flow lines, proposed as the principal structural epizone mark. This conclusion permits to discuss the defopmation quantitative analysis problem based upon the non-metamorphic sedimentation complexes tectonofacial analysis, introduced by some of the authors [5].
The epizone tectonic facies classification relative to the main deformation components
The folding compression extent classification of the epizone tectonic facies (table 1) [5], introduced by M.D.Fletty [12] is revised slightly in this paper due to specification received during the investigations.
Table 1. Epizone tectonic facies classification.
|
FOLDING TYPE |
REFLECTED FOLDING |
SURFACE GRAVI-TATI-ONAL FOLD-ING |
DEEP GRAVI-TATIONAL FOLDING |
Inclina-tion relative to the “flow lines” lamination ( Q) |
№ T.F. |
|||||
|
Tectonic formation |
Tectonic facies |
Tectonic facies |
Tectonic facies |
Interval, ° |
|
|||||
|
Inner block parts (A) |
Slightly deformed (A1) |
Subhorizontal lamination (fracture angle 170-180 ° ) |
Subhorizontal lamination (fracture angle 170-180 ° ) |
Plastic rock mass undeformed bedding |
0-5,4 |
1 |
||||
|
Monocline bedding (gentle bends, fracture angle 150-170 ° ) |
Enveloping or settling gentle bends (fracture angle 150-170 ° ) |
Gentle forced bends |
5,4-15,9 |
2 |
||||||
|
Deformed (A2) |
Interrupted (idiomorphic) gentle folding (fracture angle 135-150 ° ) |
Interrupted gentle settling folding (fracture angle 135-150 ° ) |
Isometric pillows b=c=a |
15,9-23,7 |
3 |
|||||
|
Interrupted (idiomorphic) gentle folding (fracture angle 120-135 ° ) |
Interrupted gentle settling folding (fracture angle 120-135 ° ) |
Linear pillows a=c < b |
23,7-31,4 |
4 |
||||||
|
Boundary block parts (B) |
В 1 |
Complete (holomorphic) open folding (fracture angle 105-120 ° ) |
Open gravitational folding (fracture angle 105-120 ° ) - elbow folds |
Cryptodiapiroids b=c < a |
31,4-39,1 |
5 |
||||
|
B2 |
Complete (holomorphic) open folding (fracture angle 90-105 ° ), including flexures (sharp hinge folds, fracture angle > 90° ) |
Open gravitational folding (fracture angle 90-105 ° ), roof-and-wall structure |
Cryptodiapirs b=c < a |
39,1-46,6 |
6 |
|||||
|
Complete (holomorphic) open folding (fracture angle 70-90 ° ), including flexures (sharp hinge folds, fracture angle < 90° ) |
Open gravitational folding (fracture angle 70-90 ° ) - overhanging folds |
Diapirs and diapiroids b=c < a |
46,6-56,5 |
7 |
||||||
|
Suture (fault) beds, tectonic flows (C) |
Suture folding C |
Complete (holomorphic) closed folding (fracture angle 30-70 ° ) |
Recumbent folds of the gravitational type (fracture angle 30-70 ° ) |
Diapir walls, cryptodiapiroids b > 2c |
56,5-75,9 |
8 |
||||
|
Complete (holomorphic) stress folding, isocline folds (fracture angle 10-30 ° ) |
Gravitational covers, isocline recumbent folds (fracture angle 10-30 ° ) - landslides |
Diapir walls, cryptodiapirs b > 2c |
75,9-85,3 |
9 |
||||||
|
Tectonic melange, complete (holomorphic stress folding, isocline folds (fracture angle 0- 10 ° )
|
Sedimentation melange, isocline recumbent folds (fracture angle 0-10 ° ) |
Diapir walls, diapirs and diapiroids b > 2c |
85,3-90 |
10 |
||||||
Considering the inclination relative to the rock “intralamination flow lines” as a principal epizone structural mark and bearing in mind the correlation of the latter and the “tension” parameter, it is possible to show a correlation (table 2) of the tectonic facies number (rank) and the deformation “flow” zone thickness to amplitude ratio (A/L) and, correspondingly, the deformation ellipsoid axes ratios (a/c) if they coincide with the main structural axes.
Table 2. Correspondence of the tectonic facies to the individual dimensions initially spherical elements axis (a,c) ratio and to the final uniform clear deformation components (
e a,e c)
|
№ T.F. |
Inclination relative to the “flow lines” lamination ( Q) |
Ratio A/L=tg |
Ratio a/c |
e a |
e c |
|
Interval, ° |
d=1;b=1 |
d=1;b=1 |
|||
|
1 |
0-5,4 |
0-0.087489 |
1-1.022798 |
0-0.011335 |
0-(-0.01121) |
|
2 |
5,4-15,9 |
0.087489-0.267949 |
1.022798-1.117896 |
0.011335-0.057306 |
(-0.01121)-(-0.0542) |
|
3 |
15,9-23,7 |
0.267949-0.414214 |
1.117896-1.242485 |
0.057306-0.114668 |
(-0.0542)-(-0.10287) |
|
4 |
23,7-31,4 |
0.414214-0.57735 |
1.242485-1.431628 |
0.114668-0.196507 |
(-0.10287)-(-0.16423) |
|
5 |
31,4-39,1 |
0.57735-0.767327 |
1.431628-1.718584 |
0.196507-0.310948 |
(-0.16423)-(-0.23719) |
|
6 |
39,1-46,6 |
0.767327-1 |
1.718584-2.1678 |
0.310948-0.472345 |
(-0.23719)-(-0.32081) |
|
7 |
46,6-56,5 |
1-1.428148 |
2.1678-3.275704 |
0.472345-0.80989 |
(-0.32081)-(-0.44748) |
|
8 |
56,5-75,9 |
1.428148-3.732051 |
3.275704-15.4953 |
0.80989-2.936407 |
(-0.44748)-(-0.74596) |
|
9 |
75,9-85,3 |
3.732051-11.43005 |
15.4953-132.8726 |
2.936407-10.52704 |
(-0.74596)-(-0.91325) |
|
10 |
85,3-90 |
11.43005- |
132.8726- |
10.52704- |
(-0.91325)-(-1) |
Setting the known limit conditions (the terminal flat deformation, being as a rule unifirm in the lithosphere) it is possible to calculate the deformation tensor components as well (
e a, e c) [11], giving prospects to estimate the physical deformation value of any tectonic complex. Setting definite limits (or the median values) e a and e c for the corresponding tectonic facies number of the straight deformation tensor (without taking into account the rotation tensor) providing the main structural axes correspondence (a,b,c) to the deformation ellipsoid main axes (table 2) expressed by the matrixЅ
Ц l 1 0 0ЅЅ
0 Ц l 2 0ЅЅ
0 0 Ц l 3Ѕwhere
l x= (1 - e x)2 , it is possible to define the ratio of a deformed object to non-deformed one as the given matrix determinant (according to the modulus):Ѕ
DЅ =Ц l 1 * Ц l 2 * Ц l 3Under conditions of the flat deformation of a single volume (that is the above-mentioned restrictions) b=1, e b=0, so
Ѕ
DЅ = Ц l 1 * Ц l 3Based upon these considerations the Grivenskoye gas field producing horizon deformations features were examined in the West Kuban foredeep. The corresponding tectonic facies analysis [5,13] made it possible to evaluate the above-mentioned horizon conditional deformation extent by means of the tectonic facies discrete distribution transformation to the continuous field. The deformation extent is a numerical measure of the considered Earth crust volume (fig.10).
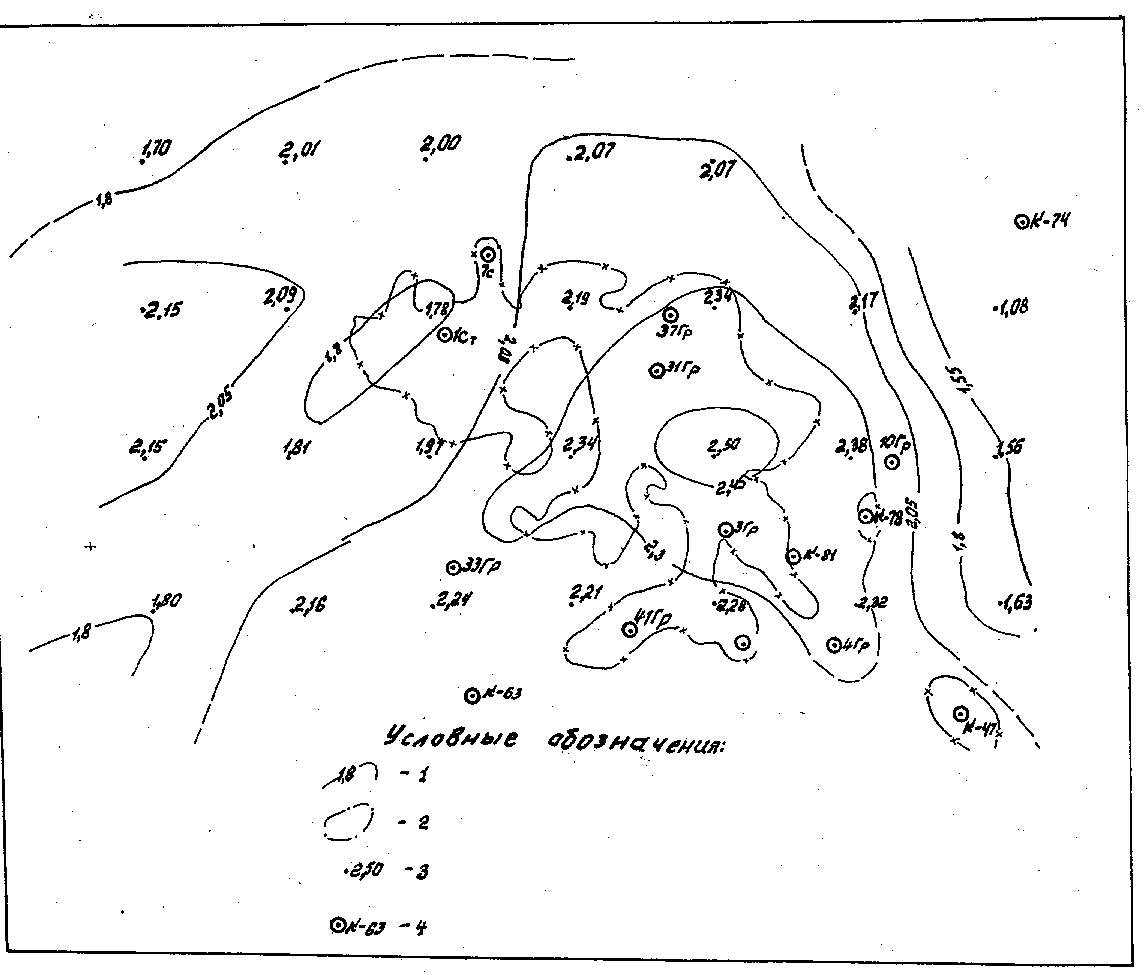
Fig.10. Map of the conditional deformation degree of the Grivenskaya area (West Сuban foredeep) Pontian gas bearing horizon. 1- conditional degree isolines of the Pontian (N
2pn) horizon deformations; 2- gas bearing boundary; 3- calculated conditional deformation degree values relative to the average value square centers; 4- drilling sites.
Using the calculated deformation components along the main structural axes corresponding to the tectonic facies numbers (ranks) (table 2) , it is possible to draw the considered horizon deformation maps (taking into account the above-mentioned restrictions), both componental and additive, fixing the deformed volume to the non-deformed one ratio (fig.11,12).


Fig.11. Maps of the deformation components
e a (above) and e c (below) of the Grivenskaya gas field productive horizon (in%).


Fig.12. Maps of the Grivenskoye gas field productive horizon deformation (above, the conditional deformation, below, the clear deformation).
The fulfilled sketches show the results being rather congruous. At the same time sertain parameters variations are outlined. The latter indicates the significance of such initial field transformations (or the deformation conditions) when a scrupulous deformation analysis of certain geological bodies is nessessary (in particular, the analysis of the sedimentation complexes under consideration).
Conclusions
1. The rock interlamination flow paragenesis is revealed during the microstructural thin section analysis of some complexes making up the anticlines under consideration. The paragenesis is formed by the rock linear components oriented along the crack belt axis.
2. The sedimentation rock linear elements orientation caused by the tectonic folding conditions is demonstrated in the southern part of the West Kuban foredeep (Krasnodar territory). The lamination complexes deformations were made according to such folding pattern.
3. The main structural mark of the epizone (non-metamorphic Earth crust sedimentation cover portion) is defined as the inclination of the rock linear components relative to the lamination. The above-mentioned mark is believed to represent the the rock interlamination flow lines. The main structural epizone triad is expressed as
R
Ѕ Ѕ ab ^ Q4. The nunerical correlations of the tectonic facies ranks to the main srtuctural and geologic parameters and the main deformation ellipsoid components are established based upon the empirical relationships; the corresponding deformation tensor determinants values are defined for the case of the eventual uniform flat straight deformation, presuming to define the deformed volume ratio of the complex under consideration (or any geologic body) to to the initially non-deformed volume.
5. The mapping method to fix the deformation peculiarities which recquire the geologic bodies analysis is developed.
The authors are grateful to V.L.Akhov, E.M.Golovachev, M.M.Zubkov and V.I.Yefimov for the long-suffering during the discussion and for the helpful remark.
literature